Living on a college budget has conditioned me to always keep an eye out for anything free that will help me accomplish my goals. Well, data visualization is a specialty of mine, so I’ve pulled together a list of free data visualization tools with a wide variety of uses and applications.
Every tool reviewed in this post came from Annie Cushing’s Must-Have Tools Google doc under the Data Visualization tab. The Google doc has fourteen tabs of amazing tools covering all the bases of internet marketing, so definitely check it out.
Creately
Creately is an organizational tool that allows users to easily create flowcharts, mind maps, Unified Modeling Language diagrams, database models, and mockups.
Free Features:
- Drag and drop interface
- PDF, JPG, or PNG exports
- Five public diagrams
- Search engine exposure
- Ability to securely embed diagrams in webpages
- Real-time collaboration for 3 members
- Online only
Upgrade Features:
- Unlimited private and public diagrams
- Real-time collaboration for an unlimited amount of members
- XML exports
- Project sharing with clients and coworkers
- User management on projects
- Online tool and/or desktop application
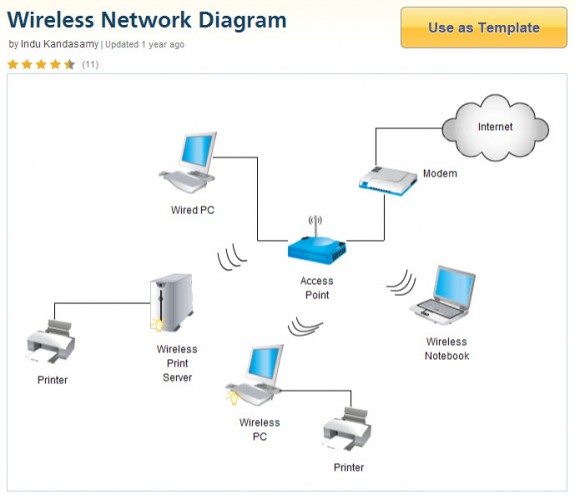
An example of a wireless network diagram made with Creately’s software:
Price: Free with uprade option
Infogr.am
Infogr.am is an online tool that allows you to create your own infographics.
Free Features:
- Six infographic templates
- Ability to add photos, video, charts, text, and maps to the infographic
- Your own Infogr.am library
- Social media sharing buttons that you can add directly to the infographic
Pro Features ($18/month):
- 10 infographic templates
- PDF or PNG downloads
- Private URLs for sharing
- Password protection
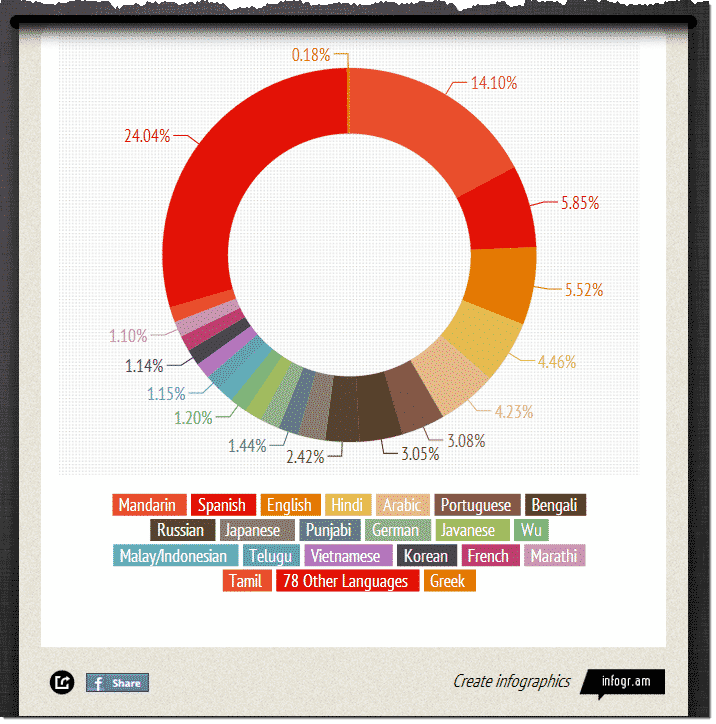
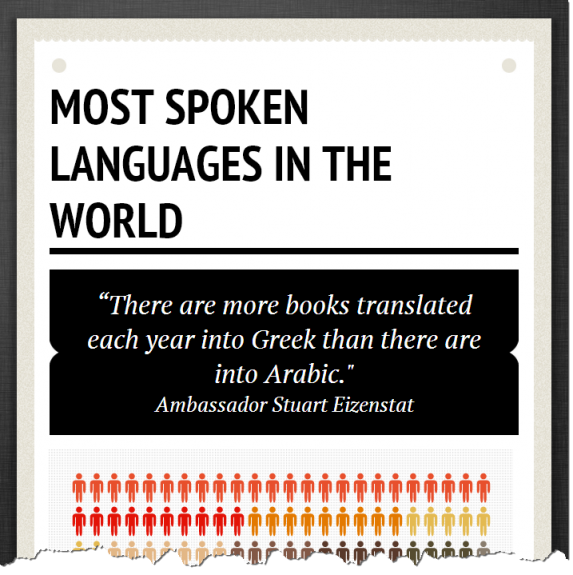
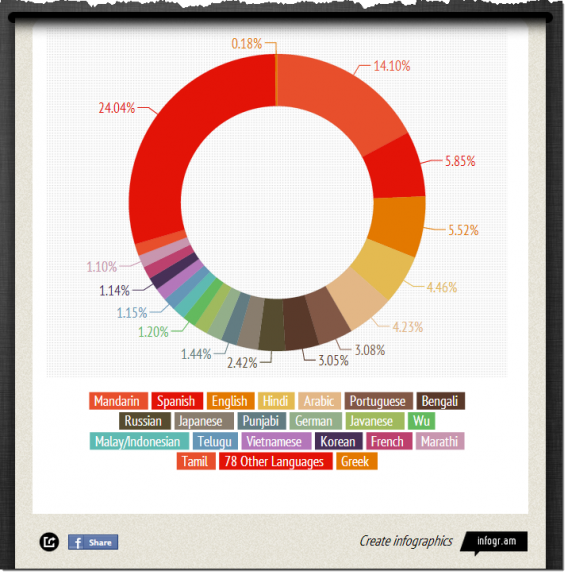
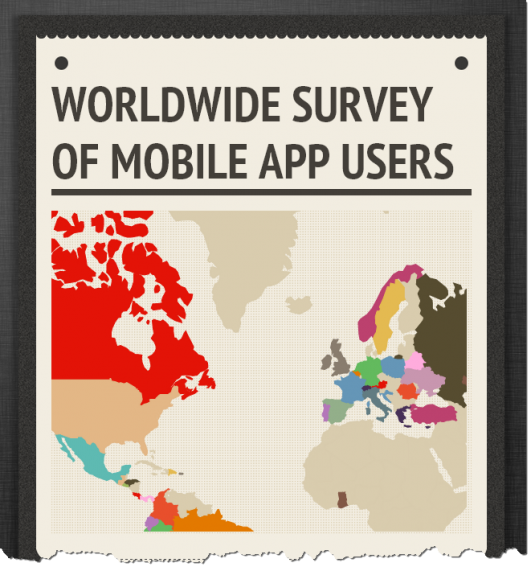
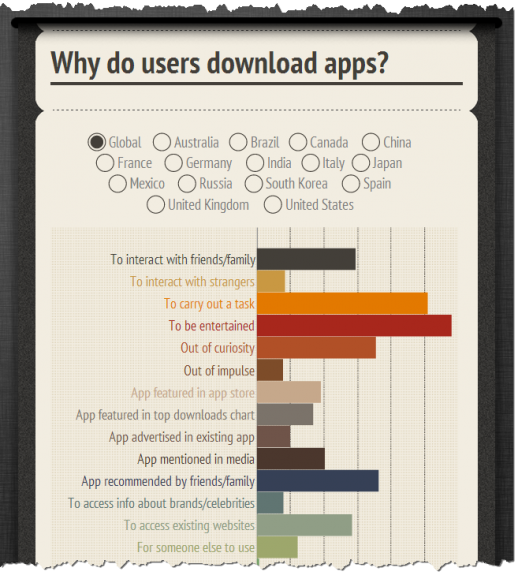
Infogr.am infographic examples:
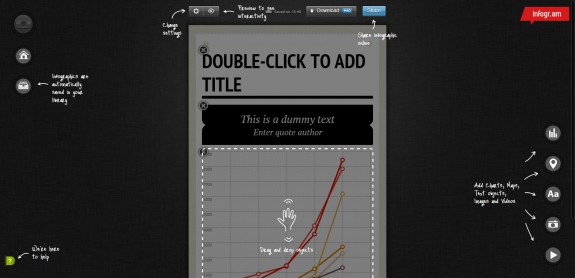
The Infogr.am interface:
Price: Free with upgrade option
Pixlr
Pixlr is an online photo editor that allows you to create your own charts, infographics, and images for free.
Features:
- Online tool, no downloading necessary
- Ability to save created images as a JPEG, PNG, BMP, TIFF or PXD (layered Pixlr image) to your computer, Flickr, Picasa, Facebook or your own Pixlr library online, if you create an account
- All the basic functionalities of Photoshop
This is also a great tool to have at your disposal for those times that you need a photo editor but aren’t at your usual work station and don’t want to use Paint. (Eww.)
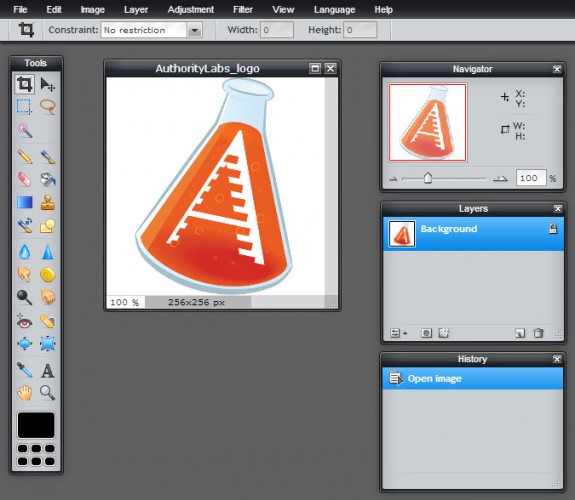
The Pixlr interface:
Price: Free
Many Eyes
Many Eyes is an online data visualizer and chart maker tool.
Features:
- 22 data visualization types to choose from
- Ability to upload XML data or free text to create visualizations
- Ability to create interactive HTML data visualizations you can embed in your website
- Embed codes or as a static image option you can share via email, Facebook, or Twitter
Important: You have to publish the visualization to download it, and all data entered into Many Eyes is publicly viewable, so don’t put confidential company info into it.
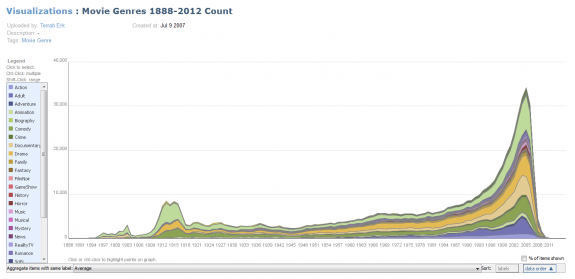
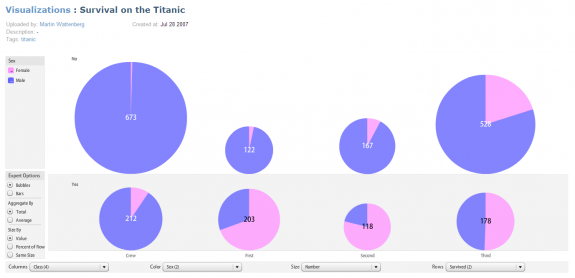
Many Eyes data visualization examples:
Price: Free
Wordle
Word clouds are all the rage but can be really useful to marketers. There are so many applications we can use as marketers, such as visualizing all the title tags of our website (or a competitor’s!), anchor tags (from inbound OR internal links), URLs, ranking keywords from a source like SEMRush or Keyword Spy, etc. Wordle makes that pretty easy and has a surprising number of customizable options for a free tool.
Features:
- Allows you to create a word cloud from a sample of text or the URL of any blog, blog feed, or any other web page that has an Atom or RSS feed
- Generates a random word cloud from your text with options to customize the language, font, layout and colors used
- Advanced option allows you to assign weight and hexadecimal colors to words that you would like emphasized
- Option to either print your word cloud or publish it publicly and receive an embed code to put the word cloud on a webpage
- Ability to maintain phrases by replacing spaces between words you want to keep together with a tilde character (useful for mapping actual keyword phrases and not just individual words)
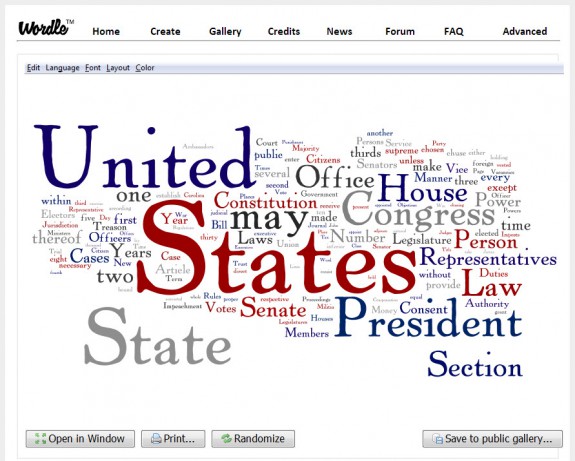
Here’s a word cloud I created from the United States’ Constitution:
Price: Free
What data visualization tools are you using?
