Wouldn’t it be nice if everything you put time and effort into went viral? We can send praise to the Google gods as much as we want, but in order to make anything go viral nowadays you have to put in good ole fashion work.

Image Source: Tumblr
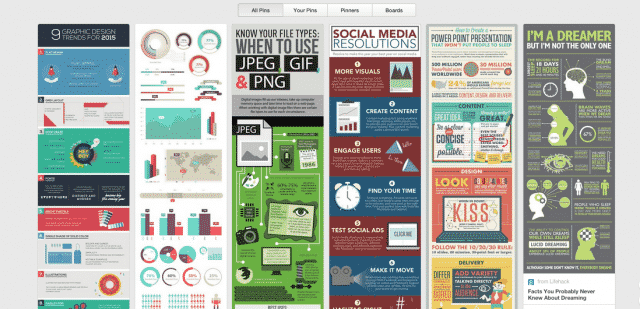
Sharing your infographic online is no different. There are hundreds of thousand of infographics out there. In fact, if you search the term “infographics” in Google over 43 million search results populate. Everything from the latest blog post about infographics (like this one) to different tools and programs you can use to create an infographic appear in search results.
So, how do you get your infographic to not only show up, but be shared across networks? Follow the below five steps, do even more research than necessary, and begin your road to virality.
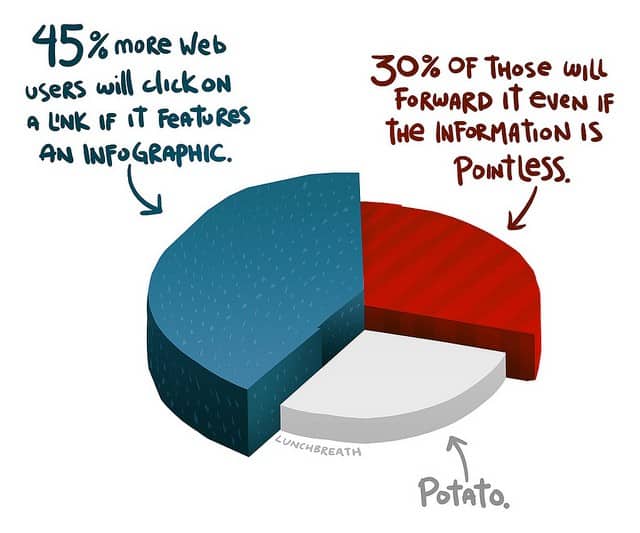 Image Source: Shout ME Loud
1. Developing Your Infographic Content
The first step in making an infographic go viral is by providing readers with valuable content and data. What information do you want to portray to the world? Do you have data that no one else has or that your demographic would be interested in? Create an infographic!
Providing Emotional Content
Data and statistics are the core of infographics, but emotion is what drives sharing. Readers need to feel attached to the content in one way or another, whether that be through curiosity, amusement, greed, sadness, anger, or passion. A great way to incorporate such emotions in your infographic is in the headline. Touch on people’s needs and wants right away with a captivating headline, while carrying emotion throughout with supporting statistics.
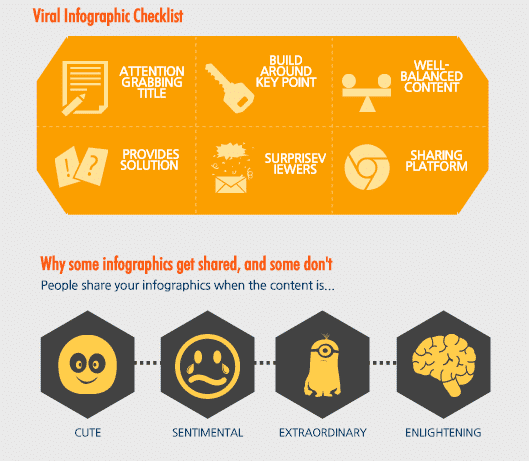
Image Source: Piktochart
Including a Call to Action
No company creates infographics for fun. There is always a purpose and business goal behind each infographic: increase sales, website traffic, link building, lead capture, or useable internal content. What helps accomplish the goal, while gaining a viral presence with an infographic is by inserting a call to action in the beginning or wrapping up the infographic with a CTA at the end. Give the viewer a reason to keep reading or desire for more information.
2. Designing the Perfect Infographic
Image Source: Visual.ly
When it comes to infographic design, the most ideal way to accomplish this task is by hiring a company that specializes in infographics. This streamlines the process and allows your design team to focus on their client’s design projects. A few of the better companies that specialize in infographic design are:
If the budget isn’t there for hiring an infographic team or if you have top-notch designers in-house, there are several different programs and resources available to assist with your infographic design.
3. Sharing on Social
Upon content and design completion, a social media sharing plan needs to be developed. Throwing an infographic into the cyber-wild and hoping enough people will like it enough to share isn’t realistic. Yes, there are infographics released by companies with large enough followings to go viral. But, for a guarantee of viral sharing you’ll need a social media plan, an embeddable infographic on your blog (makes it easy to share), and a solid scheduling tool.
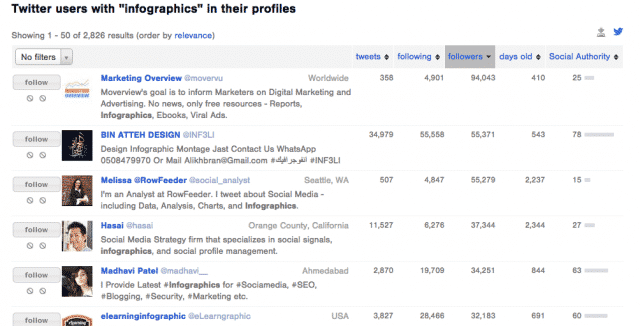
Sharing your infographic is easy using Twitter. It can be organized in specific Twitter lists, @ mentioned to influential people, and direct messaged to users who have shared infographics before. Use a tool such as Followerwonk to identify such users and hashtags.
Because tweets are constant and very rarely overused, it makes Twitter the best place to share an infographic consistently.
- In the beginning of your infographic launch, schedule your #infographic to tweet 3-5 times a day (morning, afternoon, mid-afternoon, evening, late-evening).
- Use completely different sentence structure and previews so users are still given unique content while discovering new pieces of the infographic.
- Post images of different sections of the infographic, use call-out points with links, and tweet those extra statistics that didn’t make it to the final design round.
In-between posting snippets of the infographic, share your regularly scheduled tweets and blog posts. This will help break-up your feed and give Tweeters even more variety. After a few days of constant posting, cut back to once a day for about a week. A month later you can increase and decrease tweets depending upon the past month of interaction and feedback. If you’re over-inidating users with your infographic on Twitter, they’ll let you know. Listen and respond accordingly for your future Twitter posting calendars.
Pinterest, Tumblr, and Flickr
These primarily image-based social networks are the perfect place to share a new infographic. Optimizing the caption will be the most important step during upload. Hashtags and keyword phrases that relate to the content on the infographic, as well as hashtags that are trending within the topics, will help make it go viral.
The preview size on these networks is also smaller than the actual size of most infographics, sometimes cutting as much as 1/4 depending upon length. Use this to your advantage by highlighting sections of the infographic as a preview, similar to Twitter. This gives opportunity for a call to action in the caption or a pop-up graphic on the shortened infographic with a link to the rest.
“Discover the other 8 reasons why #craftbeer has become so popular in #America
with the rest of our #infographic: bitly.com/infographic!”
You must share your infographic on Facebook. It’s the top social network, regardless of poor organic reach, and has great potential for viral sharing. To ensure a large audience reach and views on Facebook create different Facebook ads, such as Promoted Posts and custom audiences.
Develop a budget for Facebook ads and keep the infographic ads active for at least the first month of launch. This will increase the likelihood of it being viewed and shared. For example, refer to advertising on billboards in big cities. The more you see a brand’s ad spread across multiple platforms, the more you’re reminded of it.
Honorable Mentions
- LinkedIn. This business and networking-focused social network is a great place to share infographics of educational value. Post the infographic to groups it relates to, share on your own feed and @ mention people who would appreciate and share it.
- Instagram. The size of Instagram images are much too small to include all of the infographic. That’s why Instagram is another great network to give sneak-previews with links to the rest. Take screenshots of the most attractive and data-driven parts of the infographic and post on Instagram with related hashtags. #infographic #awesome
4. Submitting to Directories
Directories specific to infographics are great sources to quickly get your infographic out there, while gaining SEO benefits, such as backlinks. There are tons of directories out there happy to share your infographic. Here are a few:
- Visual.ly
- Slideshare
- Tumblr
- Infographics Showcase
- NerdGraph
- Daily Infographic
- Submit Infographics
- Cool Infographics
- Infographics Archive
- Infographic Journal
- Infographix Directory
- Infographics Only
- Infographics Showcase
- Visual Loop
- Flickr
5. Re-Activating Your Guest Posting Super Powers
Just as you scouted for potential bloggers and companies to share blog posts (and links) with, create a new list of potential websites to share your infographic with. Using the same research tools you would for blogging (Ontolo, Group High,) develop an organized Excel doc of potentials and their contact information.
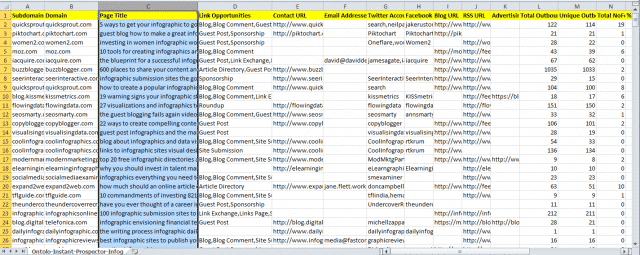
Reach out to them personally and give them a reason to share, mainly why their audience would enjoy it. This will increase your chances of them sharing it, as well as create new online relationships with similar brands.
 Image Source: The Quizzical Llama
Extra tips to make your infographic go viral:
- Press Releases. Create social media and SEO-specific press releases with several different statistics included. It’s okay to include some information about your company, but remember to keep the focus on the infographic and why it relates to them.
- Self-promote. Send your infographic to people you know and your email list, while posting on all of your social networks. Don’t be afraid to “spam” your family and friends with your new and exciting project. Develop an angle that will make any audience want to press “share”.
