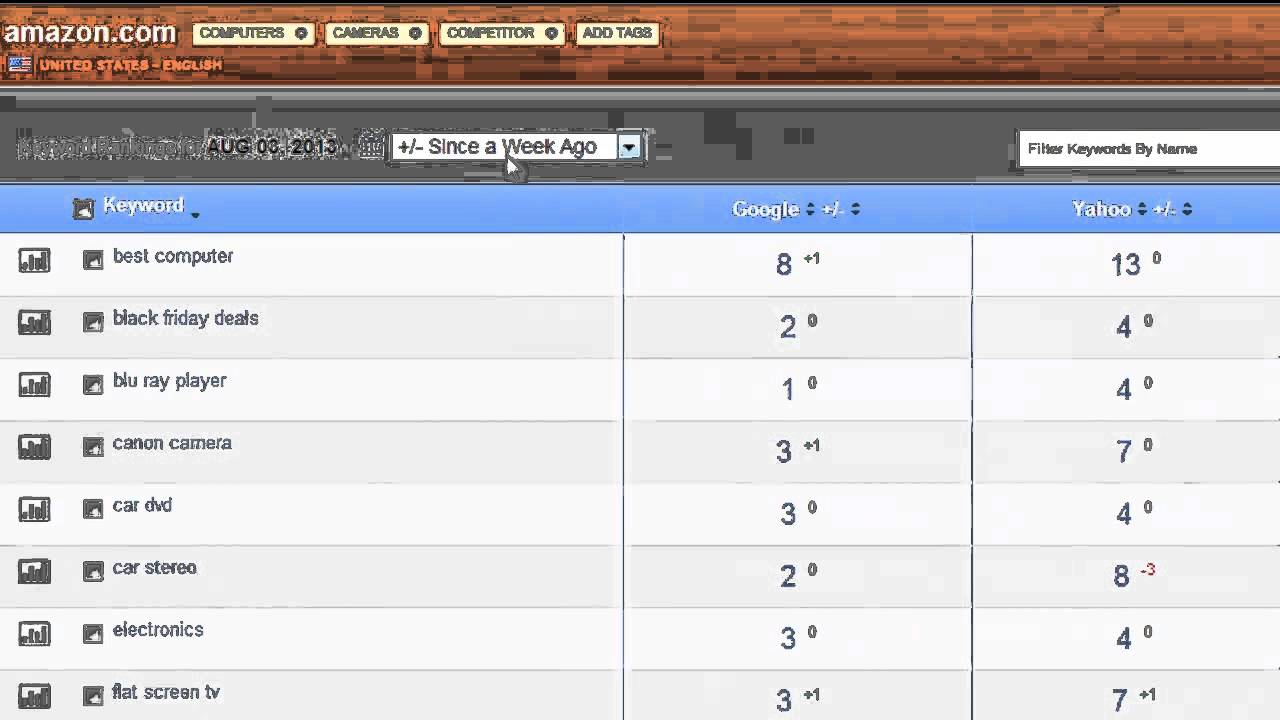
Since added drop-down: decides how far back you want the ranking data to look for your keywords
Small numbers: show how the ranking has changed over the selected amount of time
Keyword click-through: if you click on a keyword on the domain page, it will take you to a page with a line graph showing how the keyword has been performing since it was added
Part Two
Explains:
Result types: rich snippets, videos, images, etc.
Volume: shows that keyword’s relative volume compared to the other keywords being tracked under that domain
Filtering: you can filter keywords by keyword name or tag depending on which search bar you use
Graphing: When you click on the graph icon to the left of the keyword, a line graph will appear that shows how that keyword has been performing. You can click on multiple keywords’ graph icons to graph them all at the same time and compare their performance. Change the date range by choosing one of the options in the upper left corner or the search engine in the upper right. To stop graphing, deselect the graph icons.
How to edit columns: on the Options page, deselect or select check-boxes to only show the search engines or columns you want