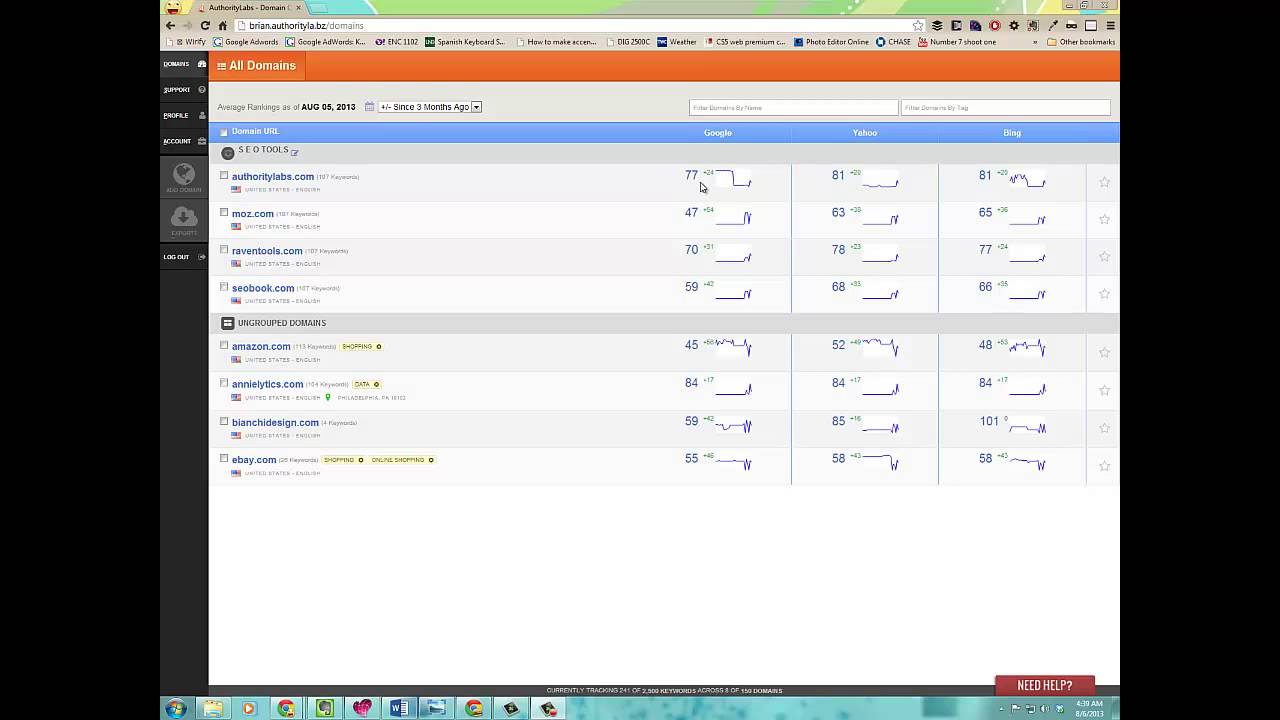
Your dashboard is a great way to get an overview of all the domains you’re tracking and how they’re performing on Google, Yahoo! and Bing. When viewing your dashboard, the small graphs to the right of each domain show the average ranks for all keywords being tracked in each domain. Each graph also shows the average change in rank for that specific keyword set on each respective search engine.

How this data is useful? Your dashboard can tell you, at a glance, various information such as increases or decreases in average rank for keywords within a domain, how your website is doing on Google vs. other search engines, how you rank on average compared to your competitors (if they’ve been added to your account), and how your international sites rank.
For a detailed walk-through of the different aspects of your dashboard, watch the video below. Here are some of the topics we go over:
© 2023 AuthorityLabs, LLC
15400 SE 30th Place, Suite 202, Bellevue, WA 98007
